


Access more than 90 health and socioeconomic indicators for Victoria at statewide, regional and local government area level on a single easy-to-use platform. Compare data for females and males, explore time trends, and download factsheets. Visit Victorian Women’s Health Atlas for more information.

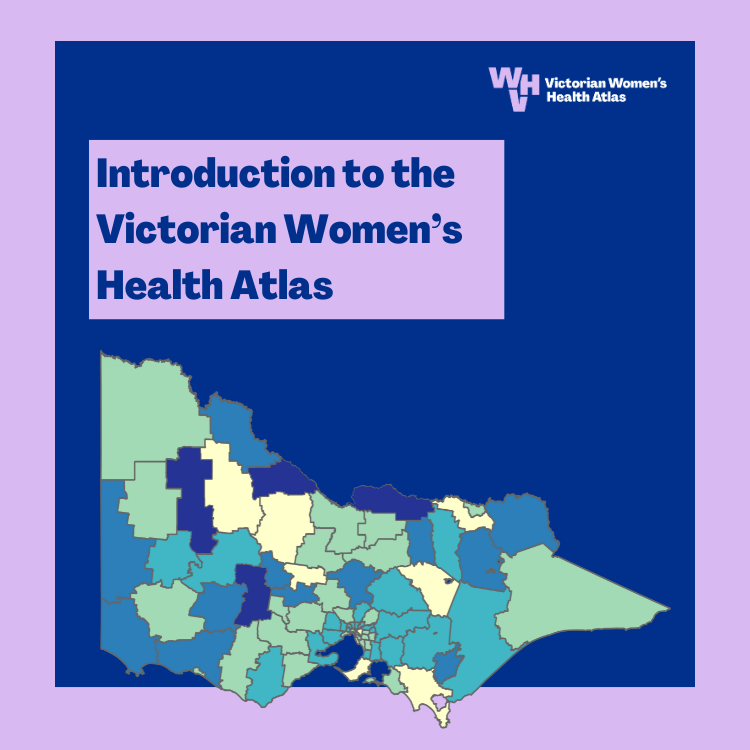
Online training: Introduction to the Victorian Women’s Health Atlas
This free introductory interactive course outlines what the Victorian Women’s Health Atlas has to offer, and how it can be used to inform policy, planning, advocacy and emerging priorities regarding women’s health and gender equality.
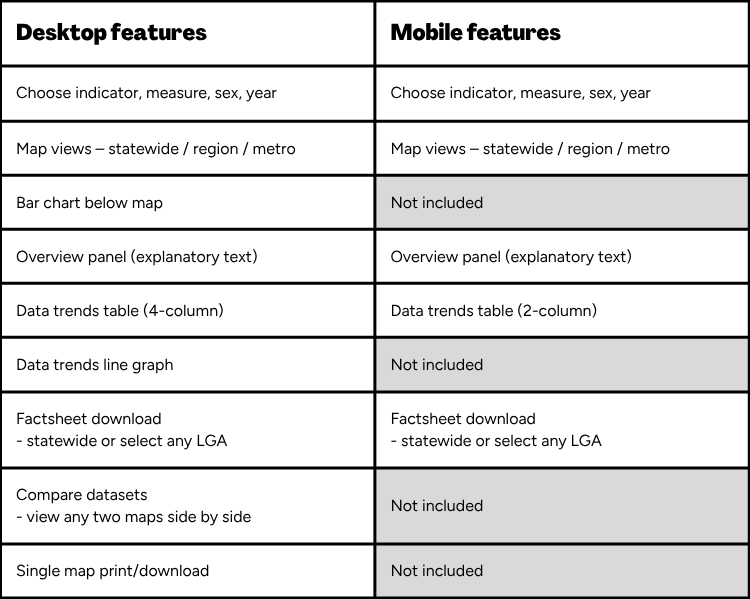
Compare desktop and mobile access
Atlas mobile view (launched in the March 2026 update) does not include all of the functions available in the Atlas desktop application. Compare here.

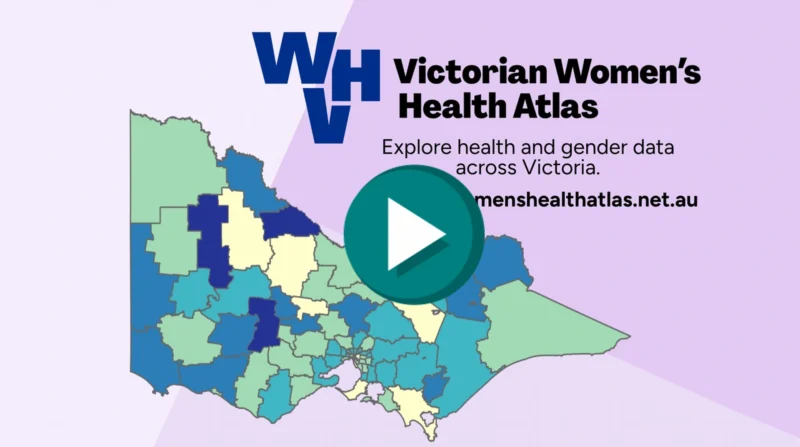
Overview slides
Tailored presentations and training
Please contact us to discuss a presentation or training tailored to your sector, region, or event.
Email: [email protected].
Text fields
Text fields provide important context for the data:
- Displayed to the right of each map in the Overview panel
- Replicated in fact sheets
- Replicated in PDF map downloads
Priority health area (eg: Chronic Disease)
This text on the home page introduces each of the 8 main Atlas categories. It summarises what is included and outlines why this matters for women’s health and wellbeing. It introduces the social determinants of health (the systems and structures in society that may impact on women’s experience of health) in this area.
Indicator overview (eg: Arthritis)
The opening paragraph describes and introduces the indicator with a focus on the datasets mapped in the Atlas. It summarises the Victorian statewide statistics shown in the Atlas, including by sex, and over time.
Discussion (eg: for Arthritis)
This section provides broader context for the indicator (is not specific to the data in the map). It expands on how the issue impacts on women’s health and wellbeing, with a focus on gender equity in health. The information is limited to key messages only (is not intended to be comprehensive). Details of helplines and support agencies are included as relevant.
Measure description (eg: Number, Rate, %, Rank)
This defines (for each individual map) exactly what is being measured/shown. It includes the time period covered by the data, who the data relates to (eg: specific age groups), data processing details (eg: how rates are calculated), and notes to guide the user, such as inclusions or exclusions, and things to be aware of when interpreting the data.
Source/s: (eg: ABS Census 2021)
This specifies (for each individual map) the data supplier, the exact data source, the date published (if public) or the date of supply (if a custom data request).
Currency (eg: Jan 2020 to Dec 2021)
This states (for each individual map) the time period covered by the data.